Are you looking for a safe place to live, work, and raise a family in Toronto? Whether you’re moving across the city or settling in for the first time, choosing a safe neighbourhood can offer peace of mind — and, as a bonus, may even lead to cheaper home, condo, or tenant insurance.
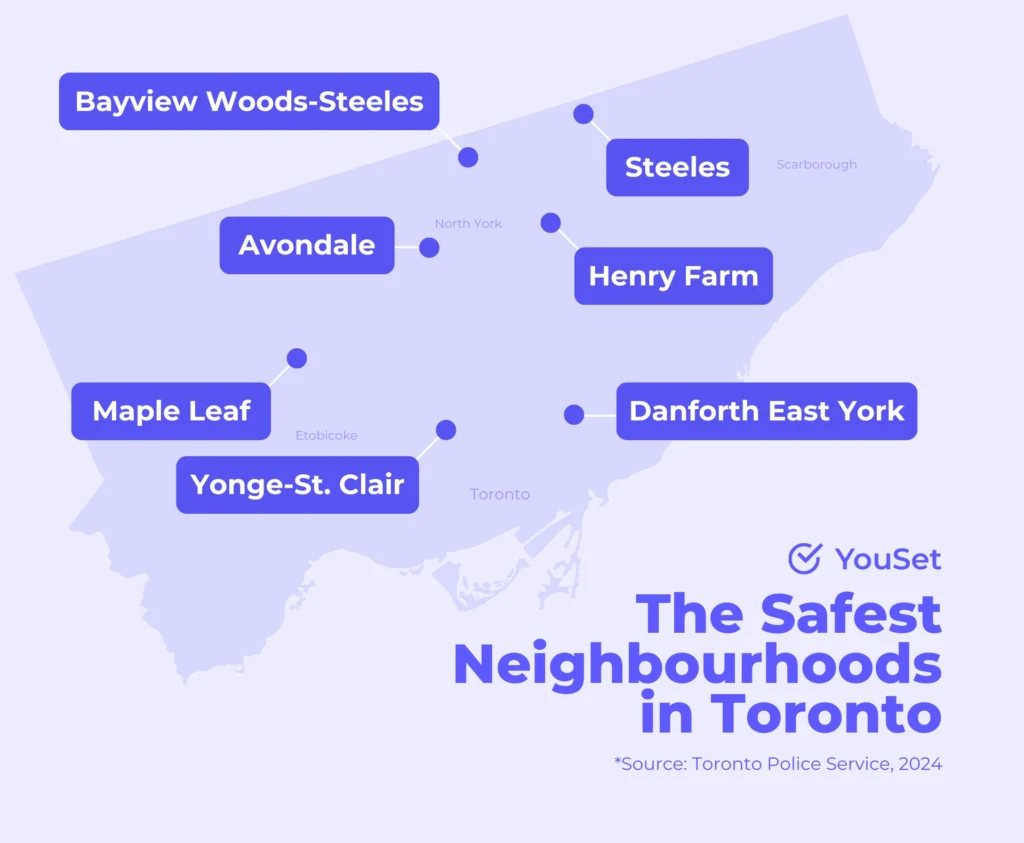
So, what are the safest neighbourhoods in Toronto? Based on 2024 crime data from the Toronto Police Service, the safest neighbourhoods in Toronto are Henry Farm, Steeles, Yonge-St. Clair, Danforth East York, Maple Leaf, Avondale, and Bayview Woods-Steeles.
Bear in mind that while crime statistics are a useful starting point, they don’t necessarily tell the whole story. Everyone’s lived experience is different, so it’s best to combine data and statistics with first-hand insights from locals and your own visit before making a decision.
📍Henry Farm
Located in the eastern part of North York, Henry Farm is a family-friendly neighbourhood with easy access to Highway 401 and Highway 404. The area features green spaces such as the nearby Sunnybrook Park and is served by several TTC routes, making it well-connected to the rest of the city.
Toronto Police data shows that Henry Farm was among the safest neighbourhoods in 2024. It had zero homicides and shootings, and for most violent and property crimes, including robbery, assault, car theft, bicycle theft, and theft from vehicles, it ranked within the lowest 25% of all Toronto neighbourhoods.
Residents appreciate not only the safety but also the strong sense of community. As longtime resident Arline Goldwater shared with CityNews, “I didn’t know a thing about the neighbourhood. And now it would take a bomb to get me out of here. The neighbourhood is a big part of it, I have just always been so comfortable here.”
- 👥 Population: 25,482 (Toronto Police Service)
- 🏢 Average rent: $1,907 as of October 2024 (CMHC)
- 🏠 Average home sale price: $613,000 in May 2025 (Zolo)
- 🗺️ Boundaries: Don River East Branch & Sheppard Avenue East (north), Victoria Park Avenue (east), Highway 401 (south), Don River East Branch (west) (City of Toronto)
| Crime type | Neighbourhood rate (per 100,000) | Average city-wide rate (per 100,00) |
| Homicide | 0.00 | 3.01 |
| Shooting | 0.00 | 14.95 |
| Robbery | 11.77 | 98.04 |
| Assault | 451.30 | 784.99 |
| Car theft | 149.12 | 277.59 |
| Theft Over $5,000 | 35.32 | 56.29 |
| Break and enter | 74.56 | 218.45 |
| Theft from a vehicle | 109.88 | 235.49 |
| Bicycle theft | 11.77 | 86.35 |
📍Steeles
Located in the northwestern corner of Scarborough, Steeles is a residential neighbourhood with access to Steeles Avenue East and Victoria Park Avenue, as well as Highway 404 for commuters. It offers a mix of quiet residential streets, local parks like Thomson Memorial Park, and convenient shopping options nearby.
With no homicides or shootings reported in the area and lower-than-average rates of robbery, assault, home break-ins, and theft from vehicles, Toronto Police data suggests Steeles was one of the safer neighbourhoods in Toronto in 2024.
Longtime resident Lakshya Selvakumaran echoes this sentiment online: “From my experience of living in this neighbourhood for about 15 years, I can say that [Steeles] is a highly liveable neighbourhood, ideal from a range of just a single person to a whole family with children. This neighbourhood is park heaven, with seven parks and community recreation facilities within its boundaries.”
- 👥 Population: 25,870 (Toronto Police Service)
- 🏢 Average rent: $1,624 as of October 2024 (CMHC)
- 🏠 Average home sale price: $954,000 in May 2025 (Zolo)
- 🗺️ Boundaries: Roughly bordered by Steeles Avenue East (north), Kennedy Road (east), McNicoll Avenue (south), and Victoria Park Avenue (west) (City of Toronto)
| Crime type | Neighbourhood rate (per 100,000) | Average city-wide rate (per 100,00) |
| Homicide | 0.00 | 3.01 |
| Shooting | 0.00 | 14.95 |
| Robbery | 34.79 | 98.04 |
| Assault | 193.27 | 784.99 |
| Car theft | 166.22 | 277.59 |
| Theft Over $5,000 | 15.46 | 56.29 |
| Break and enter | 104.37 | 218.45 |
| Theft from a vehicle | 57.98 | 235.49 |
| Bicycle theft | 23.19 | 86.35 |
📍Yonge-St.Clair
Located in midtown Toronto, just north of downtown, Yonge-St. Clair is a well-connected neighbourhood recognized for landmarks like the Rosehill Reservoir, the Vale of Avoca bridge, and the historic St. Michael’s Cemetery. It’s also home to small green spaces like the Loring-Wyle Parkette and has access to multiple TTC routes.
Despite its central location, Toronto Police data shows that Yonge-St. Clair was one of the safest neighbourhoods in 2024. It saw no homicides or shootings and had the lowest robbery rate in the city. It also ranked in the safest 25% of neighbourhoods for assault, car theft, and theft from vehicles—all indicators of a lower-than-average violent and property crime rate.
When asked about the neighbourhood on the subreddit, r/askTO, many comments were positive, like this one: “Great area, very convenient for groceries, parks, amenities and transit access. Safe, quiet area. It just doesn’t have much in the way of bougie/trendy bars or restaurants if that matters to you.”
- 👥 Population: 15,336 (Toronto Police Service)
- 🏢 Average rent: $1,954 as of October 2024 (CMHC)
- 🏠 Average home sale price: $1.8 million in May 2025 (Zolo)
- 🗺️ Boundaries: Roughly bordered by Avenue Road (west), the Kay Gardner Beltline Trail (north), Yonge Street (east), and the Canadian Pacific Railway (south) (City of Toronto)
| Crime type | Neighbourhood rate (per 100,000) | Average city-wide rate (per 100,00) |
| Homicide | 0.00 | 3.01 |
| Shooting | 0.00 | 14.95 |
| Robbery | 6.52 | 98.04 |
| Assault | 358.63 | 784.99 |
| Car theft | 130.40 | 277.59 |
| Theft Over $5,000 | 32.60 | 56.29 |
| Break and enter | 228.22 | 218.45 |
| Theft from a vehicle | 65.21 | 235.49 |
| Bicycle theft | 39.12 | 86.35 |
📍Danforth East York
Located in Toronto’s east end, Danforth East York is a primarily residential neighbourhood. It offers access to multiple TTC subway stations and bus routes, making it easy to get downtown or to the historic Danforth Music Hall.
It also happens to be one of the safest neighbourhoods in Toronto. In 2024, there were no homicides or shootings reported in the area, as well as significantly fewer incidents of robbery, assault, break-ins, and bicycle thefts than in other neighbourhoods.
Reddit users from the area share similar sentiments, with one noting: “It’s generally very safe, community feel, lots of parks for kids to run around. The best part is how close you are to the Danforth for nearby outings and activities.”
- 👥 Population: 18,201 (Toronto Police Service)
- 🏢 Average rent: $1,646 as of October 2024 (CMHC)
- 🏠 Average home sale price: $1.3 million in May 2025 (Zolo)
- 🗺️ Boundaries: Roughly bordered by Pape Avenue (west), Cosburn Avenue (north), Woodbine Avenue (east), and an area just south of Strathmore Boulevard (south) (City of Toronto)
| Crime type | Neighbourhood rate (per 100,000) | Average city-wide rate (per 100,00) |
| Homicide | 0.00 | 3.01 |
| Shooting | 0.00 | 14.95 |
| Robbery | 27.47 | 98.04 |
| Assault | 428.55 | 784.99 |
| Car theft | 225.26 | 277.59 |
| Theft Over $5,000 | 43.95 | 56.29 |
| Break and enter | 109.88 | 218.45 |
| Theft from a vehicle | 203.29 | 235.49 |
| Bicycle theft | 27.47 | 86.35 |
📍Maple Leaf
Located in the central-west part of the city, Maple Leaf is a quiet residential neighbourhood in North York. Its location offers easy access to Highway 401 and Highway 400 for commuters, parks like Maple Leaf Park and Queen’s Greenbelt for outdoor recreation, and nearby schools and community centres for families.
Based on the data Toronto Police Service released for 2024, Maple Leaf was among the safer neighbourhoods in the city of Toronto. It had notably lower-than-average violent and property crime rates, as well as no homicides or shootings reported in the area.
However, car theft was slightly higher than the city average. So, residents with vehicles may want to take extra precautions, like using steering wheel locks or parking in well-lit areas.
- 👥 Population: 11,198 (Toronto Police Service)
- 🏠 Average home sale price: $1.2 million in May 2025 (Zolo)
- 🗺️ Boundaries: Roughly bordered by Highway 401 (north), the Canadian National Railway (east), Lawrence Avenue West (south), and Culford Road (west) (City of Toronto)
| Crime type | Neighbourhood rate (per 100,000) | Average city-wide rate (per 100,00) |
| Homicide | 0.00 | 3.01 |
| Shooting | 0.00 | 14.95 |
| Robbery | 17.86 | 98.04 |
| Assault | 410.79 | 784.99 |
| Car theft | 384.00 | 277.59 |
| Theft Over $5,000 | 26.79 | 56.29 |
| Break and enter | 151.81 | 218.45 |
| Theft from a vehicle | 133.95 | 235.49 |
| Bicycle theft | 8.93 | 86.35 |
📍Avondale
Located in central North York, Avondale is a primarily residential neighbourhood prized for its easy access to Highway 401 and multiple TTC routes, making commuting straightforward. The area is also near local parks such as Avondale Park and Oriole Park, and is close to shopping hubs like Bayview Village.
Not only is getting around Toronto from Avondale relatively easy, but it’s also a pretty safe spot to call home. In 2024, the neighbourhood reported no homicides or shootings, with robbery rates below the city average. It also ranks in the lowest 25% for violent crimes like assault, as well as property crimes such as car theft, theft from a vehicle, and theft over $5,000.
- 👥 Population: 16,084 (Toronto Police Service)
- 🏠 Average home sale price: $812,000 in May 2025 (Zolo)
- 🗺️ Boundaries: Roughly bordered by Yonge Street (west), Sheppard Avenue East (north), Bayview Avenue (east), and Highway 401 (south) (City of Toronto)
| Crime type | Neighbourhood rate (per 100,000) | Average city-wide rate (per 100,00) |
| Homicide | 0.00 | 3.01 |
| Shooting | 0.00 | 14.95 |
| Robbery | 17.86 | 98.04 |
| Assault | 410.79 | 784.99 |
| Car theft | 384.00 | 277.59 |
| Theft Over $5,000 | 26.79 | 56.29 |
| Break and enter | 151.81 | 218.45 |
| Theft from a vehicle | 133.95 | 235.49 |
| Bicycle theft | 8.93 | 86.35 |
📍Bayview Woods-Steeles
Located in the northeastern part of North York, Bayview Woods-Steeles is known for its family-friendly atmosphere. The neighbourhood features landmarks such as Bayview Village Mall and East Don Parklands, with easy access to major roads like Bayview Avenue and Steeles Avenue.
Based on data reported by the Toronto Police Service, Bayview Woods-Steeles was among the safer neighbourhoods in Toronto in 2024. With no homicides or shootings reported and below-average rates of robbery, assault, and car theft, it could be an option for those seeking a quieter area.
Break-ins, however, were notably higher than the city average. Basic precautions like keeping doors and windows locked can deter opportunistic intrusions, though additional security measures like alarm systems or motion-sensor lighting can offer added peace of mind.
- 👥 Population: 14,142 (Toronto Police Service)
- 🏢 Average rent: $2,922 as of October 2024 (CMHC)
- 🏠 Average home sale price: $1.7 million in May 2025 (Zolo)
- 🗺️ Boundaries: Roughly bordered by Bayview Avenue (west), Steeles Avenue East (north), Don River (east), and Finch Avenue East (south) (City of Toronto)
| Crime type | Neighbourhood rate (per 100,000) | Average city-wide rate (per 100,00) |
| Homicide | 0.00 | 3.01 |
| Shooting | 0.00 | 14.95 |
| Robbery | 17.86 | 98.04 |
| Assault | 410.79 | 784.99 |
| Car theft | 384.00 | 277.59 |
| Theft Over $5,000 | 26.79 | 56.29 |
| Break and enter | 151.81 | 218.45 |
| Theft from a vehicle | 133.95 | 235.49 |
| Bicycle theft | 8.93 | 86.35 |
Toronto neighbourhoods FAQs
Whether you’re relocating within the city or moving to Ontario for the first time, choosing the right Toronto neighbourhood takes research (just like you’re doing by reading this article!). To help you make a more informed decision, we’ve answered some of the most commonly asked questions about the city, its safety, and how it can affect your home and car insurance.
What are the differences between Toronto neighbourhoods and suburbs?
The main difference between a Toronto neighbourhood and a suburb is that neighbourhoods are officially defined areas within the city limits, whereas suburbs may lie outside the city limits and are not always formally defined.
As of March 2022, Toronto officially has 158 neighbourhoods, all within the city’s boundaries—stretching from Etobicoke Creek in the west to the York-Durham Town Line in the east, and from Lake Ontario in the south to Steeles Avenue in the north.
Some Toronto neighbourhoods may be considered the suburbs. For example, areas in Etobicoke, Scarborough, or North York are official Toronto neighbourhoods but are farther from the city center and have characteristics often associated with suburbs, such as lower population density, detached homes, larger lots, and more green space.
Other communities, like Vaughan, Markham, and Pickering, are sometimes casually called “Toronto suburbs,” but they are independent cities outside Toronto’s boundaries. They are part of the Greater Toronto Area (GTA) and are governed separately from Toronto.
What are the best neighbourhoods in Toronto for families?
Since safety is a top priority for those with children, Henry Farm, Steeles, Yonge-St. Clair, Bayview Woods-Steeles, Maple Leaf, Danforth-East York, and Avondale would be some of the best neighbourhoods in Toronto for families, as they have some of the lowest crime rates in the city.
That said, families may also want to consider factors such as schools, public services, amenities, and access to parks and transit when choosing the right neighbourhood.
What areas in Toronto have the highest crime rates?
In Toronto, some neighbourhoods are considered more dangerous or unsafe due to their higher rates of violent crime. Beechborough-Greenbrook, Yonge-Bay Corridor, and Downtown Yonge East, in particular, are the areas with some of the highest violent crime rates. These neighbourhoods rank near the top across multiple categories, according to police data.
Toronto neighbourhoods with the highest homicide rates
According to data from Toronto Police, Beechborough-Greenbrook, Blake-Jones, and Weston are the neighbourhoods with the highest homicide rates. While the city average is 3.01 homicides per 100,000 residents, these neighbourhoods report rates between 23 and 26 per 100,000—nearly 8x higher.
| Neighbourhood | Neighbourhood rate (per 100,000) | Average city-wide rate (per 100,00) |
| Beechborough-Greenbrook | 25.92 | 3.01 |
| Blake-Jones | 24.52 | 3.01 |
| Weston | 23.16 | 3.01 |
Neighbourhoods with the highest shooting rates
According to Toronto Police data, Beechborough-Greenbrook, Elms-Old Rexdale, and Humber Heights-Westmount report the highest shooting rates. While the city average is 14 incidents per 100,000 residents, these neighbourhoods see rates five to twelve times higher.
| Neighbourhood | Neighbourhood rate (per 100,000) | Average city-wide rate (per 100,00) |
| Beechborough-Greenbrook | 168.46 | 14.95 |
| Elms-Old Rexdale | 68.95 | 14.95 |
| Humber Heights-Westmount | 68.37 | 14.95 |
Neighbourhoods with the highest robbery rates
Downtown Yonge East, Yonge-Bay Corridor, and Yorkdale-Glen Park have the highest robbery rates in Toronto, according to police data. While the city average is 98 robberies per 100,000 residents, these areas see three to four times as many incidents. This is largely because they are central Toronto neighbourhoods with heavy foot traffic, which can create more opportunities for theft and robbery.
| Neighbourhood | Neighbourhood rate (per 100,000) | Average city-wide rate (per 100,00) |
| Downtown Yonge East | 443.19 | 98.04 |
| Yonge-Bay Corridor | 392.32 | 98.04 |
| Yorkdale-Glen Park | 332.45 | 98.04 |
Neighbourhoods with the highest assault rate
Assault is the most common violent crime in Toronto, with a city average of 784 incidents per 100,000 residents. In Mimico-Queensway, Yonge-Bay Corridor, and Downtown Yonge East, however, the rate is three to five times higher.
| Neighbourhood | Neighbourhood rate (per 100,000) | Average city-wide rate (per 100,00) |
| Mimico-Queensway | 3,997.25 | 784.99 |
| Yonge-Bay Corridor | 3,355.87 | 784.99 |
| Downtown Yonge East | 2,616.92 | 784.99 |
Why is insurance higher in some Toronto neighbourhoods than in others?
The reason home and car insurance costs more in certain Toronto neighbourhoods is usually due to higher crime rates, severe weather, aging infrastructure, or local construction-related risks. When these factors increase the likelihood of claims, insurance premiums may be higher to account for the heightened risk.
For example, certain neighbourhoods in Toronto are more exposed to flood risks, and homes with finished basements are particularly vulnerable. In fact, Public Safety Canada noted in a 2022 report on insurance and flooding in Canada that “without sufficient adaptation, risk mitigation, and maintenance of aging infrastructure, development in at-risk areas will continue to drive up the costs of flooding.”
This means residents in Toronto’s neighbourhoods that are flood zones may face higher home insurance premiums to account for the increased risk.